
I previously unveiled the 10 golden rules for horse‐race handicapping. Today, I’ll conclude this series by revealing the general formulas behind the system that works for me.
First, pace. Picture the thunder of hooves as horses burst from the gate—their early fractions define the race’s rhythm. I start by collecting each runner’s early‐pace figure and then calculate the average early‐pace for the entire field. I repeat this process for the late pace, capturing how strongly each horse finishes compared to its rivals. Many data providers now use algorithms to supply these pace factors, so the raw numbers are at your fingertips.
Next, I measure pace differentials: the gap between an individual horse’s pace and the field’s average. A positive early‐pace differential—say a colt that rockets away from the gate faster than everyone else—often means he can dictate terms early without pressure. Conversely, a positive late‐pace differential signals a potent closer, someone who can rally around tiring front‐runners without having to fight other closers, or swing wide into clear running room.
With these differentials in hand—for every race of each horse—I factor in speed ratings and then apply weighting for recent races. A contest run within the last month carries 18 times the influence of a race from a year ago; one from two months ago is 53 percent more significant than a race from six months back. These weights multiply each horse’s pace differentials and speed figures, emphasizing its most recent performances.
From there, I calculate a composite horse rating. To translate that rating into a win probability, I use a convolution method that produces a bell‐shaped curve of performance around the final score. On my spreadsheet, for instance, a 79 rating corresponded to a 68 percent chance of victory, whereas a 65 rating yielded just a 1 percent chance. A simple table‐lookup function does the conversion automatically.
Finally, I convert win probabilities into true odds by dividing the probability of losing by the probability of winning. So our 68 percent chance horse carries true odds of roughly 1 to 2 (the spreadsheet shows a factor of .462). If that colt goes off at 3 to 5 on the tote (.600), there’s an overlay of about 30 percent (.600 ÷ .462), signaling a betting opportunity.
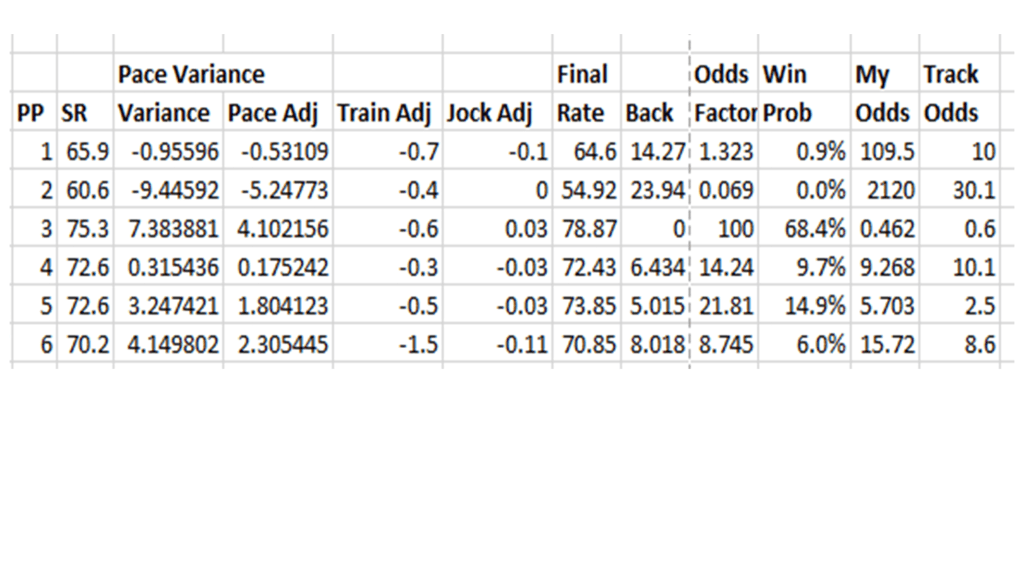
Last Saturday at Canterbury, the race I illustrate turned out to be the only race meeting my strict credibility criteria—and though the favorite’s payoff was modest at 3 to 5, the top three (3,5,4) finished in my predicted order, a rare treat when you understand statistical variation.
Those, in a nutshell, are the secrets I can share. The same formulas led to the winners of this years Preakness and Belmont. (FYI, though I liked Journalism in the Derby the terribly off track made me throw that race out for not meeting my criteria.) Patience, real data (not hearsay or media spin), and a deep grasp of variation are the keys—not only to winning at horse‐racing but to all intelligent investing. Gather accurate data, transform it into actionable information, and ignore the noise by focusing on true probabilities.
Now I’m off to the Derby City simulcast site—only one race today (the third at Churchill Downs) fits my criteria. Good luck!

Leave a comment