
In a previous week, I exposed the truth about inflation, despite the tendency of candidates to cherry-pick facts that align with their own agendas. Today, I bring forth more hard truths about the state of our economy and the strength of the stock market. Once again, it must be noted that the impact of presidents and political parties on the economy is often exaggerated. The intricacies and complexities of our financial system cannot be reduced to simple black-and-white narratives. It is important to dig deeper and consider all factors when evaluating economic success or failure.
In this first graph, we can see a clear depiction of the market fluctuations during the tenure of the most recent Republican presidents. The line on the graph moves in a jagged pattern, reflecting the ups and downs of the market under their leadership. It’s like watching a rollercoaster ride, with sudden peaks and drops that keep you on your toes. This visual representation gives us a better understanding of how the market changed during presidents time in office.
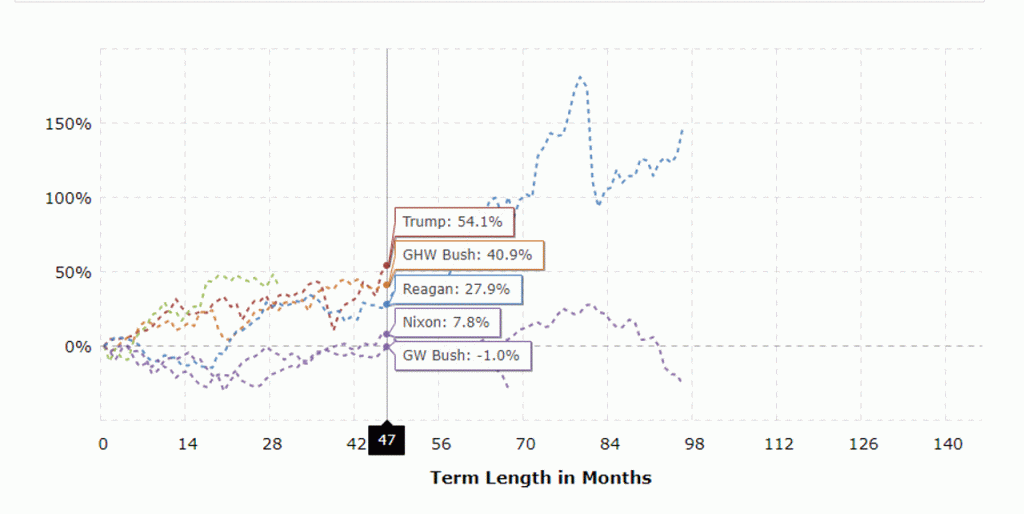
A visual analysis of the stock market reveals an interesting trend: over the course of four-year terms, (47 months used) Republican Presidents have brought about an average change of just under 26%. However, in the recent term of President Trump, this trend has been dramatically interrupted with a staggering increase of 54%. This notable deviation from the norm has sparked much discussion and speculation among economists and investors alike.
The following graph is a reflection of the shifting market under the most recent Democratic administrations. As the powerful hands of the Democrats took hold, the economy began to take on a new shape, with bold and strategic movements that left a significant impact on the nation’s financial stability. The bars of the graph climbed and dipped in response to every decision made, creating a dynamic and ever-changing landscape.

The market change in their first 4-year term was a rollercoaster of ups and downs, with an average increase of just over 45%. (44 months was reflected to include Biden data) Under the leadership of both Clinton and Obama, the market saw massive surges, with increases soaring over 65% throughout their terms. The economy was a wild and unpredictable beast, fueled by political decisions and global events. Investors held on tight as they rode through the turbulent fluctuations, uncertain of what each day would bring. But through it all, these two presidents saw solid economic stability and growth during their terms.
As I sift through this data, one thing becomes clear – the market is influenced by a variety of factors, not just political parties. The difference between the market change related to Biden versus Trump is statistically insignificant considering the variation of the market over time. In addition, the claims made by Republican Presidential candidates over the years, to be the protectors of the economy, paints a different picture considering both this and the previously published inflation data.
It seems that the state of the economy is not heavily correlated to the presidential party in office. These findings may challenge commonly held beliefs.

Leave a comment