
• Blue Dancer: A Simple Horse Racing Data Experiment

    Throughout the years, I have been involved in numerous seminars on the complex and ever-changing topics of probability, prediction, and variation. Each time, I discovered that it was far more crucial to explain the intricacies of the journey rather than simply providing superficial advice on how to choose wagers or investments. Why is this? Because in a world of constantly shifting variables, static models are insufficient.

    What might have been an effective system for assessing health risks or selecting winning racehorses at Santa Anita 50 years ago could be utterly useless today. The fact is, key variables are always evolving. From advancements in cancer treatment protocols to shifts in racetrack biases favoring early speed horses at certain courses, everything is subject to change. In essence, there is variation within variations themselves. This is why staying up-to-date and flexible is essential for accurate predictions and successful decision-making in an unpredictable world.

    Horse racing is a sport filled with endless variation, and as a seasoned professional, I often turned to my own horse’s ever-changing performance as the perfect example during seminars. In this article, I will delve into the lifelong racing journey of one of my favorite horses, Blue Dancer. Through this personal account, I aim to demonstrate the critical elements of analysis and prediction that come into play when determining a racehorse’s likelihood of winning. From unpredictable odds to strategic planning, my experiences with Blue Dancer encapsulate the complex world of horse racing and its inherent uncertainties.

    With a coat of deep, midnight blue and a sturdy but unremarkable build, Blue Dancer was not considered a great thoroughbred. But he represented the hardworking horses that graced racetracks every day across the country. While he never achieved the fame of his more illustrious counterparts, Blue Dancer still managed to place in state restricted stakes races, even as he spent most of his days competing in common claiming races.

    His racing career spanned an impressive 7 years, during which he ran a total of 72 times on various tracks around the nation. And even at the age of 9, when most horses have retired, Blue was still healthy and strong, having won 8 races. When he retired from racing he came home to the farm with me and could be found grazing in our Kentucky bluegrass pastures. He continued to reign as the dominant figure among our younger horses. Until he sadly passed away a couple years ago, the glint in his dark eyes and the playful snorts served as a reminder of his once-thriving racing days.

    Blue Dancer was not known for its speed on the racetrack, so don’t expect to see any triple digit ratings here. However, let’s take a look at his lifetime speed ratings (SR), along with the dates of his races and his performance finishes:
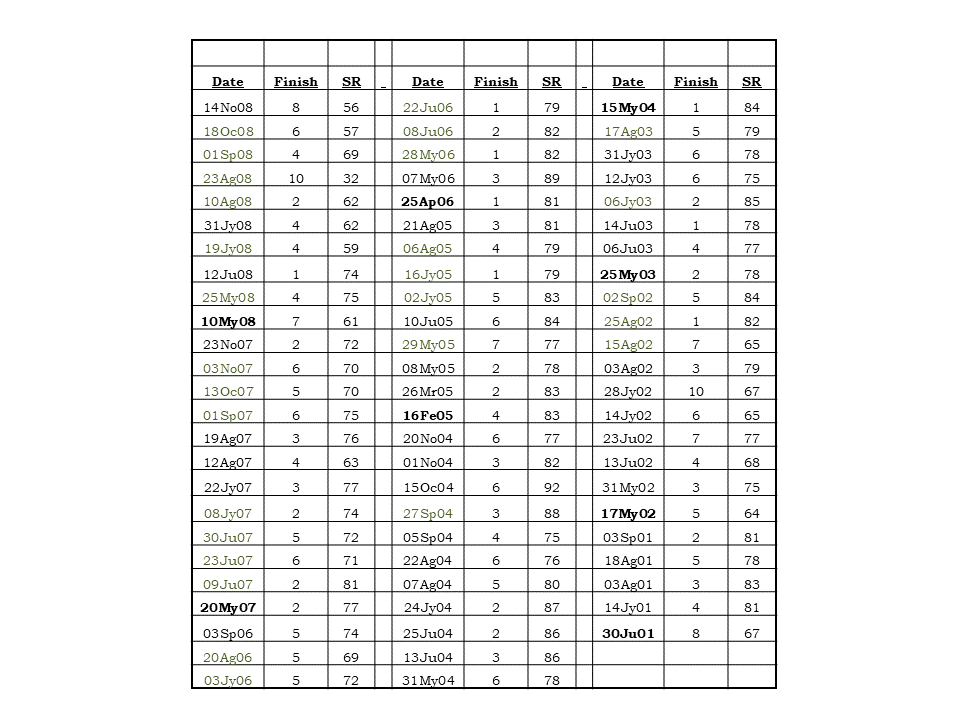
    You may question why I am using a lone horse, with an unremarkable track record, as a case study for analyzing racehorse performance. But the reason is straightforward – when constructing a functional predictive model, it is essential to eliminate extraneous variables. And in the world of horse racing, there is no greater variable than the horse itself. However, do not be mistaken, this is not just a mere example. Delving into the intricacies of a single equine career may hold the key to unlocking a deeper comprehension of the ever-changing landscape of racing.

    This article delves into the essential knowledge needed for true success in the unpredictable world of predictions. And it all begins with understanding the individual horse’s performance variation in this case. Self-proclaimed experts, I have discovered, offer little concrete evidence to back up their predictive claims. Their supposed proof is shrouded in secrecy, or they rely on nothing more than anecdotes from isolated races to support widely accepted but debunked beliefs. But through thorough longitudinal studies, I have uncovered the myths that these charlatans perpetuate for their own fame.

    Through the meticulous analysis of individual career data, I embarked on a series of “experiments”. These experiments allowed me to delve deep into the realm of predictive factors and gain insight into what truly drives future events. With each trial, patterns began to emerge and clear correlations between certain variables and outcomes were established.

    The importance of each factor was scrutinized – were finish positions more telling than speed ratings? Did jockey changes hold significant weight in predicting results? And what about seemingly trivial details such as post position or the horse’s last race? Through these experiments, previously unknown information came to light, revealing the crucial role that certain aspects play in determining future success. It was a journey of discovery through the world of data, uncovering valuable insights and expanding our understanding of how it all comes together in the world of horse racing.

    Unpredictability lurks in the shadows of even the most seemingly reliable things. No matter how much we try to control and predict outcomes, variation always sneaks its way in.

    In the world of basketball, free throws are a prime example of variation. The variables remain constant – ball, rim, distance, height – yet our performance is never consistent. We can all make a free throw, but why can’t we make it every time? It’s a maddening concept that even the best free throw shooting professional players struggle with, only making about 9 out of 10 shots on average. These elite athletes, who are paid to master their craft, still cannot escape the clutches of unpredictability. It taunts them, challenges them, reminding them that perfection is just out of reach.

    In the unforgiving world of machines and technology, even the most perfectly crafted car can falter in its first 10,000 miles. With each precise component built to withstand incredible performance tolerances, any failure seems inconceivable, yet it still happens. And what about those machines that seem to defy logic and run flawlessly for decades? But don’t be fooled by their longevity – they too are susceptible to inexplicable failures, as if mocking our attempts at control and understanding.

    For every system and machine is plagued by the inevitability of errors and variation, no matter how diligently we try to minimize them. In this battle against chaos, perfection may never be achieved, only fleeting moments of success before the next unexpected failure strikes.

    As my mind races with the exhilaration of exploring the vast sea of variation, I will force myself to refocus on Blue Dancer. My thoughts turn to the familiar frustration of missed free throws as I study the graph depicting his lifetime finishes over time. Each data point a bittersweet reminder of past victories and defeats, fueling a fiery determination to push beyond limitations and reach for greatness.

    As you gaze at the chart, you may come to the conclusion that Blue Dancer’s performance results were utterly unpredictable. However, those who claim to be experts in handicapping would scoff at such a notion and instead see evidence of foolish beliefs. They lack an understanding of statistical variation and erroneously attribute false trends, like the concept of “bounces”, to explain these results.

    In the world of horse handicapping, there are many disproven myths that continue to circulate. One such myth is the concept of a “bounce.” This term is used when a horse has an exceptional performance and some experts foolishly predict that their next performance will be subpar. In reality, this is simply a result of normal variation, much like flipping heads on a coin after flipping tails. It would be like saying Babe Ruth “bounced” in 1928 after hitting 60 home runs in 1927.

    Unfortunately, numerous experts in horse racing handicapping have gained fame for reasons completely unrelated to their understanding of probability and statistics. Being a former jockey does not automatically make someone a proficient handicapper, just like being a former NFL lineman does not give someone the ability to accurately predict future outcomes, unless they further their education and study statistical science! But setting aside these fraudulent media personalities, let’s focus on Blue Dancer and move past these antiquated beliefs.

    The past performances of Blue Dancer in his racing career were intriguing, reflecting a wide range of outcomes. He had competed at various levels throughout his career, from bottom-level claiming races to high-stakes events. Therefore, a first or fifth place finish did not always carry the same weight. To gain a better understanding of this variation and its implications for predictive data, let us examine Blue Dancer’s lifetime Speed Ratings. These numbers encapsulate the speed and performance of each race, providing insight into his overall success on the track.

    While speed ratings are not flawless, nothing truly is. They may offer a directional perspective and have significant value if used correctly as a baseline for future predictions. Many experienced trainers, veteran handicappers, and racing experts may be familiar with them, but they often fail to fully grasp their potential. When utilized properly by profit-driven handicappers, speed ratings can save valuable time. Essentially, they are designed to make data easier to interpret. Unfortunately, these technical terms may be unfamiliar to traditional handicappers, similar to how Quantum Theory would be to cavemen. Nonetheless, speed rating services use algorithms to standardize data and produce comparative ratings.

    Speed ratings are a crucial tool for horse racing enthusiasts, allowing them to objectively compare every race and every horse, regardless of track or conditions. However, the normalization process can vary between services, taking into account factors such as track biases, wind effects, and even the impact of running lanes on the racetrack’s turn semi-circles. To demonstrate this, here is a visual representation of Blue Dancer’s lifetime speed ratings as calculated by one particular service. A rainbow of colors cascades down the graph, each representing a different race and its corresponding speed rating. The fluctuations in speed are clearly visible, a testament to the ever-changing conditions on the racetrack.

    As I reminisce about my younger days in the 70’s, I can’t help but feel a sense of conflict when it comes to speed ratings. Back then, they were my obsession, spending countless hours in libraries scouring through microfiche in order to develop my own ratings for Chicago racetracks. I worked at Kemper Insurance in those early days, skipping out often to libraries or racetracks. Now, speed ratings are everywhere and easily accessible. Part of me misses the thrill of the hunt, while another part of me is grateful for the convenience.

    Upon observing the chart, one can note that Blue Dancer’s speed ratings fluctuated from race to race. Here are a few basic observations on the data:

    1. Blue Dancer’s early racing career was marked by numerous races as a two-year old, but once he surpassed this stage, his speed ratings never dipped below 69. It seemed as though he had truly found his footing on the track.

    2. During his prime, Blue Dancer’s speed ratings consistently stayed above 75 and even reached a peak of 92. His performances were like a symphony, each one building upon the last in an impressive display of skill and grace.

    3. Towards the end of his racing career, Blue Dancer’s speed ratings started to decline, averaging between 64 and 83 in his last 13 races. It was clear that age was starting to catch up with him, but he still gave it his all on the track.

    4. Despite the overall trend of a 20 point swing in Blue Dancer’s speed rating performance, three distinct time frames could be observed. The first was when he was a young and inexperienced runner, the second was when he reached his full potential as a mature athlete, and the third was when age began to impact his abilities on the track. Each phase had its own unique characteristics and contributed to Blue Dancer’s reputation as a solid mid tier performing racehorse.

    Every athlete’s performance is constantly scrutinized and evaluated, just like Peyton Manning’s quarterback ratings. But for me, it’s not enough to simply look at the surface level data. I have spent my entire life digging deeper and separating the relevant from the irrelevant.

    With every piece of information, I carefully analyze and question in order to establish accurate “probabilities” of potential outcomes. In a world where nothing is certain, probabilities are my lifeline, guiding me through the chaos and uncertainty of predicting the future.

    The world of speed rating handicappers is filled with endless theories and angles, all in an attempt to predict the future finishes of races. Some place great importance on the last recorded speed rating, believing it to be the ultimate indicator of a horse’s performance. Others focus on the last speed rating specifically on the type of track being raced on, whether it be turf, dirt, or off-track conditions.

    There are those who believe that taking an average of the last 3 speed ratings provides a more accurate prediction. And then there are those who rely on straight line trends, using recent speed ratings as a guide for potential outcomes. The air buzzes with excitement as each handicapper puts their strategy to the test, hoping to come out on top at the finish line.

    As I searched for a way to accurately predict racing probabilities, I delved into various forms of data. From analyzing individual career statistics, I discovered that normalized speed ratings were the key to unlocking my predictions. With this method, I could clearly see if past speed ratings were indicative of future performance, and much to my surprise, they were. However, the resulting predictive values often defied my expectations.

    As I delved into my data experiments, I began by closely examining individual speed rating data points. My goal was to understand the degree of variability between each speed rating throughout a horse’s entire career. It may sound like a straightforward task, but it required careful analysis and attention to detail. To demonstrate this process, I have elected to showcase the last 10 races of Blue Dancer’s career. By doing so, I hope to provide a clear understanding of the methodology behind my research.

    When trying to predict a race, many handicappers believe that the most important factor is the previous race. In this analysis, we examine whether the last speed rating can accurately forecast the next one. Specifically, we ask if the October 18, 2008 Blue Dancer speed rating was a good predictor of the November 14, 2008 Blue Dancer speed rating. The answer to this specific question is yes, as there was only a one-point difference between the ratings (57 on October 18 compared to 58 on November 14).

    Naturally, I extended this comparative analysis to all 72 of Blue Dancer’s races. This produced a total of 71 comparative data points, and as anticipated, each race showed a different level of discrepancy. For instance, the speed rating result on October 18, 2008 was 57, which was 12 points lower than the September 1, 2008 result of 69, as shown. Upon completion, my comprehensive comparative analysis throughout Blue Dancer’s career determined that the average margin of difference was 6.41 speed rating points, with some races varying more or less from this average.

    My hope is that this basic illustration serves to clarify the concepts I discussed in other blog posts. The world, especially the realm of horse racing, is inundated with an abundance of information and data. Unfortunately, only a small fraction of individuals make the effort to uncover genuine truths from it all.

    As I delved deeper into my analysis, my next inquiry was whether the previous speed rating before the last race held any more predictive value than any other speed rating in a horse’s career record. In simpler terms, I looked at the two races prior and compared them to each other, as shown below:

    Once again, the degree of variation was carefully measured at each point, and as expected, there was a greater amount of variability. The average difference between speeds increased to 7.20 points, indicating that the second race prior was not as reliable in predicting future performance compared to the one immediately before it. This is to be expected, isn’t it?

    Experienced handicappers would point out the obvious, “We all know that older races are less reliable indicators than recent ones, you idiot!” And they would be correct. However, the key difference between us is that I have access to data and the ability to experiment. I am not seeking definitive answers, but rather probabilities. So, I posed the next question: How does the third race before this one compare? And how do all the races leading up to it compare as well?

    In the early days, before spreadsheets and advanced programming capabilities, I toiled away with slide rules, clunky adding machines, cumbersome punch cards, and basic calculators in attempts to solve similar seemingly trivial inquiries. But now, thanks to modern technology, these same questions can be answered within mere seconds. The passage of time has transformed the process from a laborious and tedious task to a swift and efficient feat.

    The chart below shows how each of Blue Dancer’s speed ratings in his 72 race history compares to his previous 8 race speed ratings.

    Comparison CriteriaVariation
    Prior Race6.41
    2nd Race Prior7.20
     3rd Race Prior6.93
    4th Race Prior6.60
    5th Race Prior6.44
    6th Race Prior7.00
    7th Race Prior7.21
    8th Race Prior7.40

    In terms of predicting the upcoming race, Blue Dancer’s performance in the race just before is the most reliable indicator. However, it’s worth noting that the 5th race prior also has a high degree of predictability. The range of variation in this chart is relatively narrow, as all eight previous races have been within a 6.4 to 7.4 point difference in predicting future speed ratings. This means that each data point is equally valuable (or unhelpful) in forecasting the outcome.

    Since these results were only slightly useful, I began examining other groupings, specifically the “averages” of speed ratings. Could this have a stronger predictive value compared to just looking at a single data point? I was aware of a 6.41 degree variation in the last race prior to the one we’re trying to predict, but could grouping together several speed rating data points result in less variability?

    In order to analyze the averages, I began by calculating the average of the two previous speed ratings.

    For this illustrated example, I took the average speed ratings from October 18th and September 1st and got a rating of 63. Then, I compared that to the November 14th race, where the speed rating was 56. This resulted in a variation of 7.0 speed rating points between the actual result and the average of 63. I repeated this calculation for every race in Blue Dancer’s history

    After analyzing Blue Dancer’s racing history, I discovered that taking the average of the two previous races yielded a variation of 6.21 degrees in predicting the next race. This means that using this method would result in a more accurate prediction compared to relying on any single speed rating. In fact, by averaging the prior two speed ratings, my predictive ability improved by 3.1%. How was this possible? It turns out that taking into account more data resulted in a decrease in absolute variation, from 6.41 to 6.21. This drop of .969 translates to a significant improvement of 3.1% in predictive accuracy.

    The meticulous analysis, painstakingly expanded and conducted on a grand scale with vast samples of horses, revealed the folly of many handicappers’ fascination with the final data point. It was clear that this single point from the last race held little weight in predicting future outcomes. Just like any other data point in the world, it too was subject to the universal laws of variation. The intricate patterns and fluctuations of the racing world were no exception.

    Eager to improve the predictability of my data, I took another step forward. My eyes scanned the numbers and patterns on my screen, searching for a way to enhance my predictions. Would incorporating the average of the prior three race speed ratings make an even bigger impact on forecasting the future? The possibilities sparked excitement in my mind as I delved deeper into my calculations and analysis. This could be the key to unlocking new levels of accuracy and insight in my research. So, I asked another question.
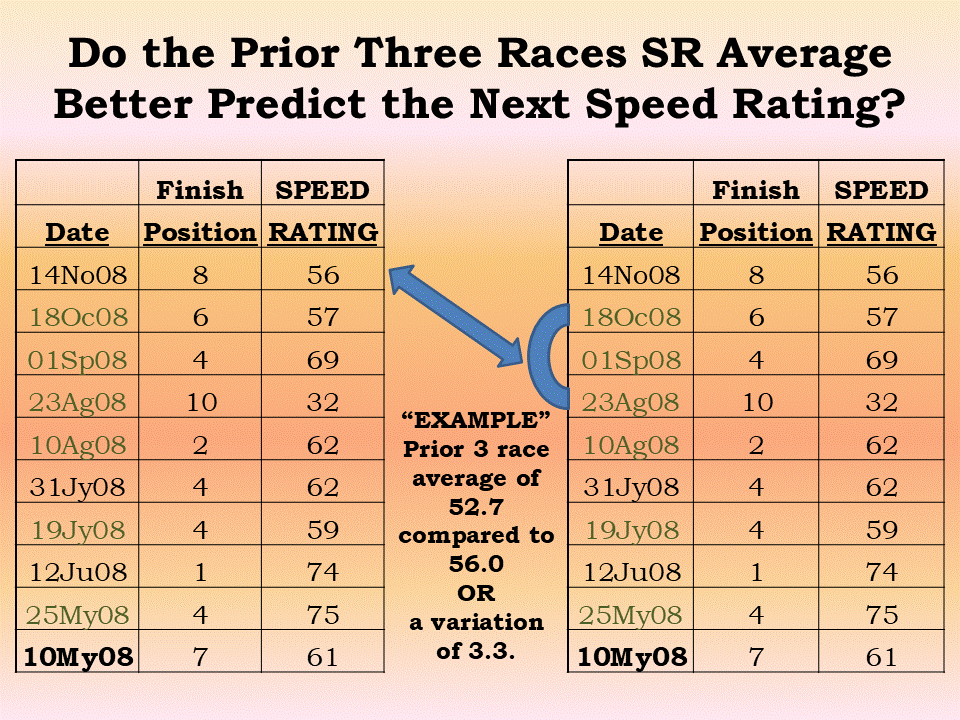
    Once more, I conducted my analysis and found that the preceding three race average consistently predicted the future with greater accuracy than any individual data point or the average of the last two races. The variation in predictions was reduced to a mere 5.55 speed rating points, a significant improvement of 13.3% compared to solely relying on the last race for future predictions.

    In my blog post “The One-Eyed King,” I discuss how I discovered the need to predict horse races 26.3% better than the average bettor in order to break even. This is due to various expenses and fees taken from betting pools by the racetrack. Now, let’s say the average bettor uses the last speed rating to make their picks. Well, I’ve just figured out a way to gain 13.3% of that necessary 26.3%!

    Foolishness runs rampant among average bettors, who throw caution and logic to the wind as they place their wagers. With no regard for the last speed rating or any other data, they blindly hope for a stroke of luck. But for those who are truly dedicated to winning, it’s crucial to constantly experiment with data. It’s about finding every single percentage point you can, combining them, and gaining a powerful mathematical edge over your opponents in the cutthroat world of pari-mutuel betting.

    Through persistent experimentation with my data, I was able to create a comprehensive table that goes all the way back to averaging the last 8 races.

     Comparison CriteriaVariation
    Prior Race6.40
    Prior 2R Avg6.21
    Prior 3R Avg5.55
    Prior 4R Avg5.25
    Prior 5R Avg5.18
    Prior 6R Avg5.07
    Prior 7R Avg5.19
    Prior 8R Avg5.19

    Upon analyzing the data, it becomes clear that the level of predictability rises with each additional recent race that is averaged. However, this trend eventually flattens out after six races. Surprisingly, the predictive value begins to decrease after considering more than six previous races. This reveals the importance of recency in making accurate predictions, and it confirms a lesson I’ve learned in the past: there is a specific point where the balance of recent and old data is optimal, and that is within the last six races – not one more or one less.

    After analyzing the average speed rating of the last six races, I noticed a difference of 5.18 points in terms of predictive accuracy. This equated to a 20.8% increase in accuracy compared to solely relying on the last speed rating. These results aligned with what I had previously observed in other areas of study: a single data point holds some significance, but it pales in comparison to the insights gained from analyzing multiple data points.

    According to the most basic principles of predictive handicapping, a horse’s performance in the previous six races holds more weight in determining its future results than any other subset of races. This is a crucial concept for value handicappers who are focused on steadily increasing their bankroll over time. By understanding this “sweet spot,” they can gain an advantage over other handicappers who are fixated on false beliefs and only give importance to a horse’s most recent race performance.

    Throughout the vast expanse of human history, people have been consumed by the allure of recent data points. It is a familiar trend, seen in the daily newspapers and online articles that flood our screens each morning. No matter the subject – whether it be sports, weather, disease, entertainment, or the stock market – these simple numbers and statistics are easy to grasp and talk about, making them prime contenders for predicting the future.

    It must be noted that the media is not driven by a desire for uncovering truth. Rather, they are fueled by ratings and profits. As a result, traditional ethics of journalism are often warped or disregarded entirely as the media sensationalizes and distorts stories based on these fleeting data points. The truth becomes secondary to generating drama, attention and revenue, creating a cycle of endlessly ridiculous and exaggerated news stories.

    The constant bombardment of nonsensical data and exaggerated stories has indoctrinated the public into unquestioningly believing every new piece of information as absolute fact. Those who are knowledgeable in the ways of diversity take advantage of their ignorance and naivety, using every chance to outsmart and outperform the unsuspecting majority. In the dog-eat-dog realm of horse racing, this is evident in the overwhelming odds stacked against us, a clear reflection of the gullibility and simplicity of the masses.

    A universal advantage awaits those who possess a deep understanding of variation in all forms of endeavor. Like the keen eye of a seasoned gambler, I have analyzed data and discovered that the last 6 Thoroughbred horse races hold more predictive power for future outcomes than the last 1, 3, 5 or 10. This same powerful process applies to all aspects of life, unlocking secrets and opportunities for those with the knowledge and insight to harness it.

    This was just one simple data experiment. I wanted to illustrate the detail of such a simple experiment to demonstrate how unanswerable problems can become clearer. Hidden probabilities and truths often emerge in stages.

    Will this past 6 race knowledge hold forever? Doubt lingers like a shadow, shrouding the answer in uncertainty. Will the percentages I reflected in here hold forever? To some degree but with each passing moment they crumble and shift like shifting sands in a desert storm.

    Did I discover that this past 6 race recency probability value could be improved upon by looking at dates of the races, types of racing surface, conditions of the track, utilizing an exponential (not linear) trend calculation of speed ratings rather than simple averages to predict future results? Yes, they did.

    To unlock secrets, one must dive deep into the endless abyss of data, navigating treacherous waters and braving the unknown depths. And even then, there are no guarantees, for fate is fickle and can change in an instant. This knowledge is a double-edged sword that must be wielded with caution and skill.


  • The Transformative Power of Rational Decision Making

    Wisdom often slips through our fingers like grains of sand. Countless individuals dedicate their lives to sharpening their skills and amassing knowledge, blissfully unaware that these endeavors might not hold the significance they presume. To truly attain wisdom and achieve success, one must master the art of action. In essence, it is crucial to understand how to take calculated risks and make sound decisions. The possession of knowledge and skills in areas such as teaching, where one molds young minds; carpentry, where raw materials are transformed into functional art; retail management, where the dance of supply and demand unfolds; or automotive engineering, where machines are brought to life, may not seamlessly translate into triumph when it comes to launching a school, crafting a housing project, acquiring a business, or inaugurating a car dealership.

    Success is defined by the ability to make sound decisions, seize opportunities, and skillfully navigate challenges. The truly wise recognize that it is not merely about the accumulation of knowledge, but rather how one applies that knowledge in the complex tapestry of the real world. They possess the keen insight to look beyond the surface, discerning the deeper implications and potential ripple effects of their actions.

    When confronted with a challenging decision, individuals of wisdom do not falter. They engage in a thoughtful deliberation, meticulously weighing all options and considering every possible outcome before making their move. And when they decide to take risks, they do so with unwavering confidence and resolute determination, fully aware that fortune often rewards those who dare to be bold.

    Ultimately, it’s not merely about possessing skills or knowledge; it’s about wielding the wisdom to deploy them with precision and impact. This profound wisdom is the razor-sharp blade that slices the truly successful apart from the mediocre masses.

    To acquire this type of wisdom, one must delve deeply into a fundamental aspect of the human experience: our innate tendency to gravitate towards drama. In the modern world, where media pervades every corner of our consciousness with sensational stories rather than straightforward facts, this craving has intensified to an unprecedented degree. This allure often drags even the most intelligent and capable individuals into a quagmire of mediocrity, where the tempest of emotions and the theatrics of drama hold sway. Why does this occur? Because people are irresistibly drawn to whatever their emotions deem significant, much like moths to a flame. In contrast, wise individuals have mastered the art of sifting through the noise to discern what truly matters in any given situation, like skilled navigators charting a course through turbulent seas.

    Amidst the swirling chaos and relentless noise of everyday life, they grasp the secret to success: remaining centered and unwaveringly focused on the broader horizon. It is their unique ability to peer through the myriad distractions, sifting through the clamor to identify what truly holds significance. This clarity of vision empowers them to make informed and deliberate decisions, ensuring they stay steadfast on the path towards their aspirations.

    As the wise navigate through the complexities of life, they do so with a sense of purpose and clarity that sets them apart. When others falter or get swept away by the tide of emotions, they stand firm like a beacon of light in the darkness, guiding themselves and those around them towards brighter horizons.

    In a world where uncertainty looms large and challenges abound, it is this wisdom that serves as a guiding force, illuminating the path ahead and instilling confidence in the face of adversity. And so, armed with their deep understanding of human nature and the world around them, the wise continue to carve their way through life’s intricate tapestry, leaving a legacy of resilience and sagacity for generations to come.

    This article and website primarily aim to offer techniques for differentiating between perceived importance and genuine importance. Perceived importance is frequently driven by irrational emotions and our inclination for drama, whereas genuine importance is grounded in logic and reason. In essence, there are ways to attain wisdom!

    Throughout my life, I’ve been on a mission to teach people the art of dodging drama like a ninja in a soap opera. My lessons might sound as thrilling as watching paint dry—covering the riveting worlds of variation, quality, statistics, and predictive analysis—but trust me, they’re the secret sauce to living a life free of manipulation and overblown theatrics. Who knew that math could be your drama-free best friend?

    Even though some students acted like they were allergic to learning, there were always a few who soaked up the lessons like sponges and ended up becoming the Einsteins of their fields. As an old geezer, it tickles me pink to get a postcard or email from former students or pals who actually did something smart with what I taught them. But I’ve gotta admit, it’s a bit of a head-scratcher when I discover that even the ones who looked more interested in their shoelaces than my classes somehow managed to use my teachings to their advantage years later. Go figure!

    Among the many students I’ve taught, one really made an impression on me—like a coffee stain on a white shirt. She graced my statistics and quality control classes nearly three decades ago, often looking like she was solving the mysteries of the universe or just doodling the next Picasso in her notebook. Fast forward to two weeks before I was about to hang up my corporate boots, I got a call that was more surprising than finding a pineapple on a pizza.

    Susan had gone on to achieve a high-level executive position and she was reaching out to express her gratitude for my teachings. She explained how she found herself in a challenging position during a merger that required a deep understanding of statistical analysis. Thanks to the lessons she learned, she was able to spot issues within the IT operations of her company and improve their quality control processes. It had just struck her that she wanted to thank me for introducing her to these fields and experts so many years ago. It was a touching reminder.

    Despite our relentless efforts, only a scant few attendees genuinely grasp the lessons imparted. The majority merely coast through, feigning comprehension while blatantly disregarding the teachings. In a stark revelation, I tasked my human resources department with conducting a survey on leadership sessions about quality control and statistical processes. The findings were utterly disheartening: out of 100 surveyed, a staggering 50 were too lazy to lift a finger, 35 were desperately chasing validation with no real intent to learn, 10 made a half-hearted attempt but crumbled when faced with adversity, and a mere 5 harnessed the knowledge to truly achieve success.

    It’s amusing how those 5% made everything worthwhile. They were the ones who truly absorbed the knowledge, allowing it to sink deep into their minds and hearts, and went on to make tangible changes in their lives. Watching them transform was like witnessing a caterpillar morph into a butterfly, vibrant and full of potential. And for me, that was enough. Although it was a small number, they were the driving force behind my passion to teach. They were the reason I continued to stand before a classroom, eager to reach more curious minds and ignite that same blazing fire of discovery and growth within them.

    Eventually, I retired from the corporate world. Retirement was supposed to be my chance to escape from the topics that had consumed my entire career. I longed for a break, a chance to breathe and let go of constant analysis and evaluation. But now that I had all the time in the world, I found myself at a loss. Without these topics, what was left? Yet diving back into them felt overwhelming and suffocating. I was torn between my desire for rest and my fear of losing the very things that defined me.

    Driven by a burning desire to escape the shackles of my corporate career, I delved into seemingly mundane topics, far removed from the world of health care and operations. In this new realm, I found pure joy and unearthed shocking truths amidst the rubble of millions’ blind beliefs. These discoveries became my obsession, fueling me with a relentless determination to expose the hidden realities of our society.

    How does one discover the truth? How can you free yourself from the addiction to drama? How do you make logical decisions instead of emotional ones? How can you gain confidence in taking risks? And how do you sift through information and determine what is truly important?

    I can assure you that the answers to these questions are not found in the media, newspapers, elected officials, or self-proclaimed experts who may not even understand basic data analysis. The only way to find answers is by looking at the data itself and learning how to analyze it.

    To truly grasp the importance and impact of any subject, whether it be weather patterns, NFL quarterback performances, climate change statistics, business processing errors rates, political strategies, or horse racing outcomes, one must embark on a crucial journey: delving straight to the source and meticulously examining the raw data.

    Only by immersing ourselves in the numbers, facts, and figures can we gain a comprehensive understanding of the bigger picture at hand. It is through this analytical process that we can unveil the true story behind each scenario and make informed judgments and decisions.

    As I immersed myself into the labyrinthine world of data analysis, a pattern slowly emerged from the seemingly chaotic information. Each set of data held a crucial piece to unraveling the truth that lay hidden within. For example, the repetitive cycles of weather patterns hinted at looming storms and Mother Nature’s wrath waiting to unleash on an unassuming world. Yet, amidst all this, there were also signs of manipulation and exaggeration by the media, attempting to conjure up unnecessary drama and stress.

    A closer examination of NFL quarterbacks’ performances revealed more than just numbers on a scoreboard; it spoke of their unwavering determination, finely-honed skills, and the key factors that ultimately led to victories for each team. Hidden factors, available to all but discovered by few, gave me an edge in the complex sports gambling world, now so easily available to everyone.

    As some businesses processed its high error rates, flaws in the system were exposed – weaknesses that had been hidden beneath the surface. Root causes of problems were finally brought to light, no longer able to be masked by apparent issues. Like cracks waiting to be exploited or fixed, these vulnerabilities could not be ignored any longer.

    Political strategies played out on a grand stage, revealing the intricate power play and manipulation at play – a timeless game that dictated much of society’s actions, and clearly dictated winning potential of candidates.

    Even in the seemingly trivial world of horse racing outcomes, there were underlying lessons waiting to be learned. Lessons on unpredictability, chance, and the exhilarating rush of taking risks – a reminder that life is full of surprises and sometimes it’s worth betting on the unknown outcome if you discover the hidden world of what is important in the wagering world, and what is purely irrelevant.

    As I delved deeper into each new dataset, my confidence swelled and spread like a wildfire. No longer trapped by the chains of doubt or influenced by fleeting emotions, I approached decisions with a clear mind and sharp logic. The power of reason surged through my veins, guiding me towards the most logical conclusions.

    Yet, as I reflected on this newfound clarity, a thought crept into my mind: where did beliefs fit into this world of logic and reason? Were they mere illusions, easily swayed by external factors? Or were they a vital piece of the puzzle, shaping our perceptions and driving our actions?

    My research into debunking myths and unraveling false beliefs led me down many twisted paths. With each new revelation, I uncovered layers upon layers of deception that had been cleverly woven into the fabric of society. It was a daunting task, but one that ignited a fire within me to shine a light on the shadows of ignorance and superstition. By approaching deceit with rigorous methodology, we can gain a deeper understanding and debunk commonly accepted misconceptions.

    So let us not shy away from digging deep into the data, for it holds the key to unraveling mysteries and unlocking knowledge and in my case, pure joy.

  • Ghosts and Reality: Separating Fact from Fiction

    Through my research, I have unearthed a multitude of false beliefs, myths, and misconceptions that plague the minds of people. These dangerous ideas fuel irrational behaviors and extreme reactions, from the benign belief in a flat Earth or ghosts to the harmful notions that COVID is a hoax or that migrants are solely responsible for a false belief that there is a surge in crime. These delusions warp individuals’ perception of reality, causing them to view the world through a distorted and often destructive lens.

    To introduce just one myth, let’s simply discuss ghosts. According to recent 2022 surveys in the United States, one of the most advanced and educated nations in the world, some interesting statistics have emerged:

    – 41% of Americans believe in ghosts

    – 20% are unsure about their existence

    – 18% claim to have seen or been near a ghost

    Another even more recent credible survey indicated that 36% of the American population believes in ghosts, with 24% claiming to have had a personal encounter.

    These surveys reveal a staggering number – approximately 133 million Americans hold a belief in the supernatural and 65 million have personally experienced a ghostly encounter. In simpler terms, for every 5 individuals you come across, two will harbor a belief in ghosts and one will have their own firsthand account to share. This data paints a portrait of a drama addicted nation deeply connected to the realm of the unknown, where spirits and specters roam and leave an indelible impression on those who believe they have been touched by their presence.

    So now, as I said, let’s look at the data, but guess what? The data is nonexistent. No data, no truth! Let’s all just try to think about this for a minute.

    Centuries of human existence, countless advancements in technology, the devastating toll of death, and widespread access to instant capturing devices like phones have all yielded no concrete evidence. Despite the widespread belief in ghosts as lingering spirits that haunt the living, their existence defies all known laws of physics. Not a single experimental result has been deemed valid by the scientific community, leaving the truth behind these supposed entities shrouded in unsettling mystery.

    Despite the belief of 133 million Americans, there is no evidence or truth to suggest that ghosts actually exist. While this may be an unpopular statement, it is a fact that cannot be denied. Unlike other unseen physical effects, such as magnetism which was discovered in 600 BC and eventually proven through observations, experiments, and statistical proof, ghosts lack any tangible evidence. They remain simply a fictional concept with no basis in reality. So while some may continue to believe in their existence, the truth remains that ghosts are nothing more than figments of our imagination.

    An alarming 40% of the highly educated population have embraced a complete fabrication as truth. Can you fathom the sheer volume of other erroneous beliefs people hold? And even more chilling, imagine the vast number of false assumptions you could uncover, gaining a crucial edge over the masses who blindly follow and suffer from these lies.

  • The Decline and Future of American Horse Racing

    On a bright afternoon many years ago, I gathered with a small group of individuals involved in the horse racing industry in my state. The scent of freshly cut grass and hay filled the air as we sat around a large table, discussing the current state of affairs.

    We were facing some challenges, but there was also reason for optimism due to developments such as a card club and a lucrative new partnership with a local tribal group. The card club had provided much-needed subsidy funding for the race track for several years, while the tribal group had just agreed to make a generous payment over 10 years to prevent any attempts by racing interests to push for slot machines. It was a delicate balance, but one that had helped keep the industry thriving in our state.

    The state’s lack of progress weighed heavily on my mind, especially in an industry that was already lagging behind. While other states were aggressively pushing for improvements and embracing new forms of gambling, our leaders seemed satisfied with a limited arrangement with the tribal group, which had an expiration date looming over us like a dark cloud. Despite the promises made by negotiators, it was clear to me that this agreement would eventually dissolve, leaving us with a missed opportunity for progress and further falling behind our neighboring states in terms of gaming and revenue generation.

    It was a frustrating and conflicting situation, knowing that there was potential for growth but feeling held back by outdated thinking and unwillingness to change.

    In the past, it seemed like racing was destined to fail in smaller states without external support. No matter how much money was generated through bets, it could never cover the high expenses associated with the sport – from purse amounts paid out to race owners to providing top-notch care for the horses. Racing simply couldn’t sustain itself on its own. This struggle was not limited to one state; it was a harsh reality faced by racing communities across the country.

    Desperate for survival, racing had turned to alternative forms of gaming for sustenance and subsidies. Other states pushed hard for Historical Horse Racing (a form of slot machine based on prior races) and Sportsbooks which everybody with a lick of sense knew were on the horizon. Those elements were added to other states repertoires.

    With each new development, it became clear that racing’s sole purpose was to act as a loss leader while other forms of gambling reaped the rewards and subsidized the unprofitable racing product. It was a vicious cycle of dependency and exploitation, with no end in sight.

    As I sat in many meetings, pouring over data and statistics, it became painfully clear that the world of Thoroughbred racing was facing a rapid decline. The numbers showed a steady downward trend, and it was impossible to ignore the inevitable consequences. It was clear that second and third tier racing environments were struggling to survive, and without significant changes to the economic model, the industry would have to drastically contract in order to stay afloat.

    As I presented my findings locally, I couldn’t help but feel a sense of urgency. Subsidies, while helpful in the short term, could only delay the inevitable decline of the core racing product. It was losing its competitive edge against other forms of entertainment and gambling, and something needed to be done before it was too late.

    Like I had anticipated, my findings in an industry as ancient as time itself were met with doubt and criticism. My regression analysis charts and trend illustrations were picked apart, as if the mathematical equations were merely opinions rather than supported evidence. (Can we really argue against 2 plus 2 equaling 4?) But the true difficulty arose when I suggested implementing changes to improve local racing and breeding. It felt like trying to move a mountain that had been rooted in place for centuries.

    Though the breeding issues were unique to my state, due to antiquated misunderstanding of behavior, the proposed solutions were not just opinions, but promising strategies supported by solid evidence and research. These interconnected ideas form a comprehensive plan to revitalize the struggling sport yet today.

    The first proposal involves creating faster and dual saddling paddocks, which would inject excitement and increase betting activity, making races occur more frequently thus enhancing the thrill for spectators. However, the plan goes beyond just increasing pace and action for the consumers. It also includes implementing cutting-edge technology (high definiton sound and visual monitoring everywhere at the racetrack) to prevent cheating proactively, rather than merely detecting it after the fact.

    Yes, it is necessary to restore trust and integrity to the sport, as fans are flocking to other more trustworthy and action oriented sports and entertainment activities. Additionally, the establishment of centralized laboratories and a single regulatory body in the United States would ensure consistency and fairness for all participants, creating a more equitable competitive environment. An obvious issue which continues to be fought by horse people and regulators who wish to maintain their power on a state by state basis.

    We also need to establish a new system that prioritizes the protection and well-being of horses in racing. This involves implementing mandatory testing for “every horse” after each race, rather than just the top finishers. (Whoever came up with the idea of only drug testing the top two finishers clearly didn’t understand how cheating works in the real world.) This system, plus the full video and audio monitoring of every backside, would serve as a comprehensive safety net, ensuring the health of these majestic creatures.

    The once dull and empty infields could also be transformed into vibrant spaces, filled with cheering fans and colorful picnic blankets. The access to the animals, new viewing perspectives and picnic type atmosphere would be full of excitement and energy as everyone gathers to celebrate these magnificent animals.

    Racing surfaces themselves also need a comprehensive overhaul; safer options like lush, verdant turf and state-of-the-art artificial tracks should replace the perilous dirt paths that posed greater risks to both the majestic horses and their skilled riders. The emerald grass would cushion hooves and provide secure footing, while the meticulously engineered synthetic surfaces would offer consistent traction in all weather conditions.

    Instead of dangerous, breakneck sprints that push horses to their physical limits, I passionately advocate for longer, more secure race distances that would not only protect the noble steeds from injury but also captivate audiences with heart-pounding, suspenseful finishes. Again the data, and even European examples, speak for themselves.

    Finally, reimagining betting structures to include thrilling head-to-head matchup wagers or nail-biting plus/minus finishing positions or lengths would add an electrifying extra layer of excitement to the wagering experience. These innovative betting options would tantalize the senses and get pulses racing, enticing jaded old fans back to the track while drawing curious new spectators into this storied tradition steeped in pageantry and drama. The roar of the crowd, the thundering of hooves, and the heart-pounding anticipation of a photo finish would be amplified by these engaging new ways to test one’s luck and judgment against the unpredictable nature of horse racing.

    Carefully curated and extensively researched, every recommendation is supported by proper statistical analysis. Countless studies had uncovered a common factor for the decline in fan engagement: the pace of events. Gone were the nostalgic days of Seabiscuit, where eager fans could devote their undivided attention to one event every 40 minutes. In today’s fast-paced world, there seemed to be an endless stream of rapid-fire action available to fans around the globe, leaving little time for reflection or anticipation.

    The dark cloud of cheating has long loomed over the racing world, constantly making its way into the headlines. Despite efforts to address the issue, it persists in various forms beyond just performance-enhancing drugs. One major area of concern is the lack of preparation given to predicted favorites for races, leaving them vulnerable to underhanded tactics. Moreover, regulatory agencies fall short in their responsibilities by not fully testing all competitors for potential drug interactions, and neglecting advanced technology that could monitor behaviors leading up to races. The race to win has led some to cut corners and bend the rules, tarnishing the integrity of the sport.

    For years, numerous meticulous studies have consistently shown that dirt track races and short distance sprints pose a significantly higher risk compared to their counterparts on lush turf and longer tracks. The numbers speak for themselves: horses thundering across unforgiving dirt, their hooves pounding relentlessly, are at a much greater risk of sustaining catastrophic injuries.

    Despite increasing national attention and pressure to address the high number of equine fatalities, the American racing industry stubbornly clings to tradition and disregards their own data, seemingly turning a blind eye to these alarming trends. Instead they take baby steps and advertise slight fatality improvements while knowing they could do so much more. Their reluctance to make sweeping changes is evident, like a jockey refusing to alter course even when danger is imminent.

    Moreover, the wagering landscape in horse racing appears almost quaint and outdated when compared to the sophisticated, instantaneous betting options available in other sports. While fans of football, basketball, and other popular games can place bets with lightning speed on a myriad of outcomes, horse racing’s wagering system feels antiquated and cumbersome. The contrast is stark: a world of real-time, in-game betting opportunities versus the comparatively limited and slow-paced options at the track.

    This wagering option disparity renders horse racing’s betting experience almost laughable, a relic of a bygone era struggling to keep pace with the rapid evolution of sports gambling.

    The traditional leaders of the racing world still yearn for a simple solution to rejuvenate their declining sport. They reminisce about the glory days, when horse racing was thriving. However, the challenges they face are complex and interconnected. Despite their desire for a quick fix, it is evident that multiple approaches are necessary to tackle the underlying problems.

    Something must be done to truly address the core issues surrounding entertainment value, wagering participation, and maintaining integrity. Meanwhile, I struggle with conflicting emotions of fondness for the past and the recognition that change is imperative for the sustainability of horse racing.

    As I reflect on my childhood memories, I can’t help but feel a sense of sadness for the once grand racetracks that have now fallen into disrepair. The cruel hand of time has left its mark on these once glorious structures. Some, like Arlington Park in Chicago where The Arlington Million used to be held, have been demolished.

    Out of the 100 racetracks that stood in 1975, only 43 remain today. It seems inevitable that all but the major event racetracks wil eventually disappear as each day passes. The legacy of Thoroughbred racing is slowly fading away, evident in the dwindling number of foals born annually: only around 17,000 today compared to the 45,000 born in 1975.

    The impact of this decline has hit the West Coast particularly hard. Beloved racetracks like Hollywood Park and Bay Meadows are now only fond memories. Smaller tracks, such as Portland Meadows and Yakima Meadows, have also succumbed to this inevitable fate. The remaining strongholds, like Del Mar and Santa Anita, fight desperately to stay afloat, while lesser-known tracks like Los Alamitos and Emerald Downs struggle to keep going. It’s truly tragic that despite all this, the solutions to racing’s problems remain unchanged and ignored until it’s too late to save the once-great second and third tier tracks that have already disappeared into obscurity.

    The current state of American racing is a sharp contrast to its glory days. In the last decade alone, from 2014 through 2023, wagering revenue has only increased by a measly 10.4%. However, when taking into account the 28.7% inflation rate during that same period, it becomes clear that this growth is not as significant as it appears.

    In real terms, wagering revenue has actually decreased by another 14.2% over the past ten years. And to make matters worse, the latest figures for this year show a decline of 3.2% in revenue compared to the previous year. When adjusting for inflation once again, this means that real revenue has dropped by a staggering 6.4% in just one year. The decline of American racing shows no signs of slowing down, and the numbers speak for themselves.

    Every May, the Kentucky Derby and Triple Crown races captivate viewers with their glamour and excitement, showcasing the thrill of horse racing. However, I can’t help but feel torn about the sport. While these high-profile events draw in millions, it’s hard to ignore the thousands of foals that are bred each year but never make it to the track. The smaller-scale races with modest prize money reveal a different, more difficult side of the industry – one filled with struggle and decline. And unfortunately, this means that second and third tier racetracks will continue to disappear.

    Part of me still thrills at the pageantry and tradition, the thundering hooves and cheering crowds. But another part sees the flaws – shortsighted leadership, shrinking audiences, and ethical concerns about animal welfare. I want to embrace racing’s magic and history, but I’m increasingly troubled by its systemic issues. The sport seems caught between its glorious past and an uncertain future, leaving fans like me torn between nostalgia and disillusionment.

  • Practical Examples of Predictive Skills through Statistics

    “Without a grasp on random variation and probabilities, one’s intelligence will always be infected by myths and emotions.”

    Be it acquiring a new home or horse, leading a sports team to victory, indulging in fatty meals, gambling recklessly on football matches, investing in stocks, or enduring toxic jobs and relationships, the ability to predict outcomes is what separates the successful from the mediocre. And to master this skill, one must delve into the complex science of statistical analysis and understanding variation. Fail to do so, and failure will surely follow.

    It is imperative to understand that the ability to predict events accurately is completely irrelevant when it comes to certain occurrences. Take the simple act of flipping a coin, for example. In this case, I will never be able to out-predict you because the outcome is purely random.

    There is an equal 50% chance that either heads or tails will appear. However, just for the fun of it, let’s imagine that I have a belief – or perhaps a little superstition – that wearing my shirt inside out will increase my chances of getting a heads on the coin flip. And lo and behold, after turning my shirt inside out, I manage to land three consecutive heads in a row. One might think that this verifies my belief, but in reality, it simply proves that luck played a role in the outcome rather than any predictive skills on my part.

    I refuse to bore you with tedious and mind-numbing coin flip probability theories. Despite my actuarial friends’ impressive intellect, I wrote these articles with the average Joe in mind. No need for complicated jargon or theoretical discussions. Instead, let’s dive right into practical examples that will make sense to anyone. Even a seemingly straightforward task like flipping a coin can involve complex calculations and theories that can leave your head spinning.

    The origins of myths are often shrouded in mystery, and my crazy inside out shirt coin flipping myth is no exception. It may have stemmed from a random comment I overheard, or a questionable claim I stumbled upon online. Perhaps a seasoned coin flipper endorsed it to a group of novices, or it was touted on a televised program. It’s even possible that an old man like myself wrote a book about it. But regardless of its source, one thing remains certain – it worked. And once I saw with my own eyes the power of turning my shirt inside out to bring me riches, I became obsessed and unstoppable. Nothing can shake my belief now, for I am living proof that this strange ritual yields unimaginable success, right?

    The inside out shirt myth may seem absurd, but it is just one among thousands of ludicrous beliefs that permeate our society. People blindly cling to these nonsensical ideas, like the notion that consuming red meats and cow’s milk was once considered healthy. But in the future, we will look back with horror at how such practices were accepted as truth. My apologies for this glimpse into a bleak and merciless reality.

    Bill Cosby, Jared Fogle, and “all” priests were once revered as paragons of virtue and compassion. But the truth is now undeniable – their sinister actions have been exposed. Just like how dropping a single penny from the top of the Empire State building cannot end a life, the myths associated with these men’s virtue have caused immeasurable harm. Yes, I have some friends and family who moronically deny the flaws of these men despite mounds and mounds of data. Those feeble minded folks instead believe in foolish conspiracy theories.

    Despite overwhelming evidence to the contrary, some will always hold onto false beliefs, like the myth that Poinsettias are poisonous or that lightning never strikes twice in the same place. But perhaps the most shocking falsehood of all was when so-called experts declared that Donald Trump could never become President – and we all know how that turned out. The cold reality is that sometimes the most unbelievable things can actually happen.

    Myths thrive on the distorted perceptions and misfortunes of unsuspecting victims. These delusions, fueled by random anecdotes masquerading as truth, are perpetuated by the manipulation of media outlets. Observing the fluctuation of the stock market index on a daily basis, we are bombarded with sensationalized headlines that falsely attribute minor shifts to major causes. These exaggerated claims only serve to fuel the chaotic frenzy, feeding into the hands of those who seek to exploit the uninformed masses, and of course, our addiction to drama.

    Flipping heads three times in a row with a coin does not prove anything, nor does it increase your chances of having a successful coin flip by wearing your shirt inside out. These three flips are simply coincidental and should not be taken as evidence. However, it is difficult to explain the concept of random variation to individuals who have always relied on anecdotal observations as facts. As a result, they spend their lives worrying about and making decisions based on random events.

    Without a deep understanding of random variation and probabilities, your intelligence will always be tainted by the infectious spread of myths and emotions. Yes, I do mean infected – people have fallen victim to ludicrous anecdotes, often perpetuated by the sensationalized media or deceitful charlatans. So many widely accepted beliefs are nothing but unproven and unsubstantiated myths, polluting minds with their toxic influence.

    For example. despite what society may tell you, staying in a stagnant job is not a sign of stability, it’s a trap. The cold hard truth? Switching jobs can om average increase your income more in just one month compared to staying put for 3 years. But that comes with risk, conflict, and the fear of stepping out of your comfort zone. And yet, so many cling to their current job like drowning sailors to a lifeboat, never realizing they are sinking deeper into financial ruin. Don’t be like those people – take a moment to consider the wasted potential of the next 3 years if you stay stuck in your safe but stagnant job. It’s time to take a leap of faith and bet on yourself for once.

    For example. despite what society may tell you, staying in a stagnant job is not a sign of stability, it’s a trap. The cold hard truth? Switching jobs can om average increase your income more in just one month compared to staying put for 3 years. But that comes with risk, conflict, and the fear of stepping out of your comfort zone. And yet, so many cling to their current job like drowning sailors to a lifeboat, never realizing they are sinking deeper into financial ruin. Don’t be like those people – take a moment to consider the wasted potential of the next 3 years if you stay stuck in your safe but stagnant job. It’s time to take a leap of faith and bet on yourself for once.

    For another example, in the cutthroat world of horse racing, there is a theory known as “lone speed” that strikes fear into the hearts of seasoned bettors. It’s a handicapping theory, constantly referred to by media handicappers. Of course these handicappers wouldn’t know credible data from a regression analysis but be that as it may, they think that if a horse possesses such raw and undeniable early speed in a race that other horse do not have any early speed, that it can dominate the race without any competition.

    The “lone speed” theory is widely accepted among horse racing experts. According to this theory, horses that have quick acceleration and can break away from the pack are at an advantage because they avoid the pressure of competing with other horses. This allows them to set a comfortable pace, conserve energy, and run close to the inner rail, which means they cover less distance due to the curvature of the track. Essentially, this theory suggests that a lone speed horse has a high likelihood of winning, and if such a horse can be identified using past race performances, it would be a smart bet. This theory has been tried and tested for many years in the world of horse racing.

    More to come